Documentation Index
Fetch the complete documentation index at: https://docs.bigdata.com/llms.txt
Use this file to discover all available pages before exploring further.
Why It Matters
AI disruption requires identifying which companies will thrive versus those vulnerable to displacement, but evaluating AI positioning across scattered news, earnings calls, and filings is resource-intensive. Investment decisions need systematic analysis of both AI risks and strategic responses to identify winners and potential shorts.What It Does
TheGenerateReport class in the bigdata-research-tools package systematically evaluates both AI disruption risks and proactive AI adoption across company watchlists using unstructured data from multiple sources. Built for portfolio managers and financial analysts, it transforms scattered AI-related information into quantifiable positioning intelligence and identifies investment opportunities based on AI readiness.
How It Works
TheGenerateReport combines semantic content retrieval, dual-theme analysis, and comparative scoring methodologies to deliver:
- Risk-proactivity assessment measuring both AI disruption vulnerability and strategic AI adoption initiatives
- Standardized scoring system enabling cross-company comparison of AI positioning and competitive readiness
- Investment intelligence generation revealing underlying narratives that shape each company’s AI transformation journey
- Structured output for reporting ranking companies by AI resilience and strategic positioning
A Real-World Use Case
This cookbook demonstrates the complete workflow through analyzing AI disruption risks and proactive responses across a company watchlist, showing how the generator automatically quantifies AI positioning and identifies potential investment opportunities based on strategic AI readiness. Ready to get started? Let’s dive in!Prerequisites
To run the Report Generator workflow, you can choose between two options:-
💻 GitHub cookbook
- Use this if you prefer working locally or in a custom environment.
- Follow the setup and execution instructions in the
README.md. - API keys are required:
- Option 1: Follow the key setup process described in the
README.md - Option 2: Refer to this guide: How to initialise environment variables
- ❗ When using this method, you must manually add the OpenAI API key:
- ❗ When using this method, you must manually add the OpenAI API key:
- Option 1: Follow the key setup process described in the
-
🐳 Docker Installation
- Docker installation is available for containerized deployment.
- Provides an alternative setup method with containerized deployment, simplifying the environment configuration for those preferring Docker-based solutions.
Setup and Imports
Below is the Python code required for setting up our environment and importing necessary libraries.Defining the Report Parameters
Fixed Parameters
- Keywords (
keywords): Keywords used for improving retrieval - Main Theme (
main_theme_risk): The central concept to explore - Main Theme Proactivity (
main_theme_proactivity): Proactive measures and strategies companies take to address the main theme risk - List of sentences about risks themes (
list_sentences_risks): Sentences used to improve the retrieval regarding the main theme - List of sentences about risks proactivity themes (
list_sentences_proactivity): Sentences used to improve the retrieval regarding the proactivity against the main theme - Bigdata (
bigdata): Bigdata connection
Customizable Parameters
- Watchlist (
my_watchlist_id): The set of companies to analyze. This is the ID of your watchlist in the watchlist section of the app. - Model Selection (
llm_model): The LLM model used to label search result document chunks and generate summaries - Frequency (
freq): The frequency of the date ranges to search over. Supported values:Y: Yearly intervals.M: Monthly intervals.W: Weekly intervals.D: Daily intervals. Defaults to3M.
- Time Period (
start_dateandend_date): The date range over which to run the analysis - Fiscal Year (
fiscal_year): If the document type is transcripts or filings, fiscal year needs to be specified - Focus (
focus): Specify a focus within the main theme - Document Limit (
document_limit_news,document_limit_filings,document_limit_transcripts): The maximum number of documents to return per query to Bigdata API for each category of documents - Batch Size (
batch_size): The number of entities to include in a single batched query
Generate Report
We initialize the class GenerateReport and in the following section of the cookbook, we will go through each step used by this class to generate the report. In the colab cookbook you can skip the step-by-step process and directly run thegenerate_report() method in the section Direct Method.
Retrieve Content
You can leverage the Bigdata API to run a search on company news, filings and transcripts.Label the Results
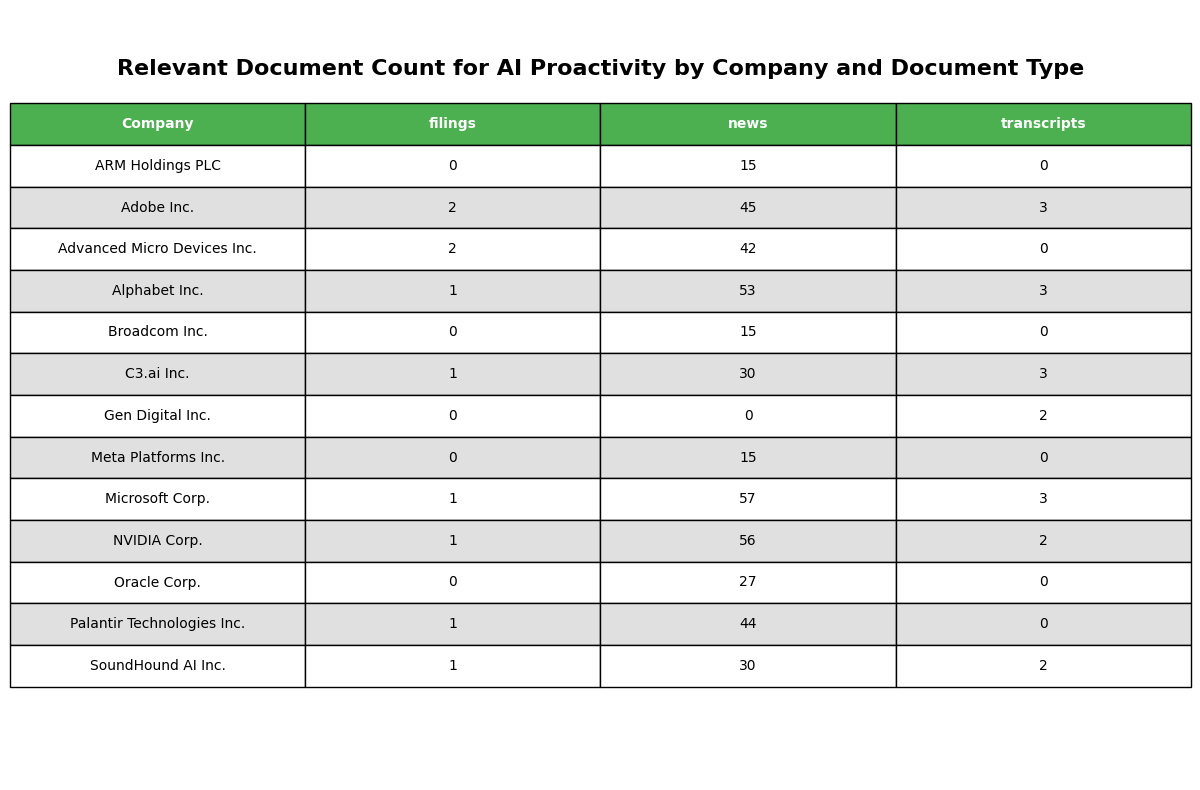
Use an LLM to analyze each document chunk and determine its relevance to the main theme. Any document chunks which aren’t explicitly linked to AI Disruption Risk will be filtered out.Document Distribution Visualization
You can visualize the tables showing the count of different document types for each company in the given universe. This helps you understand the distribution and availability of information across different sources for each entity.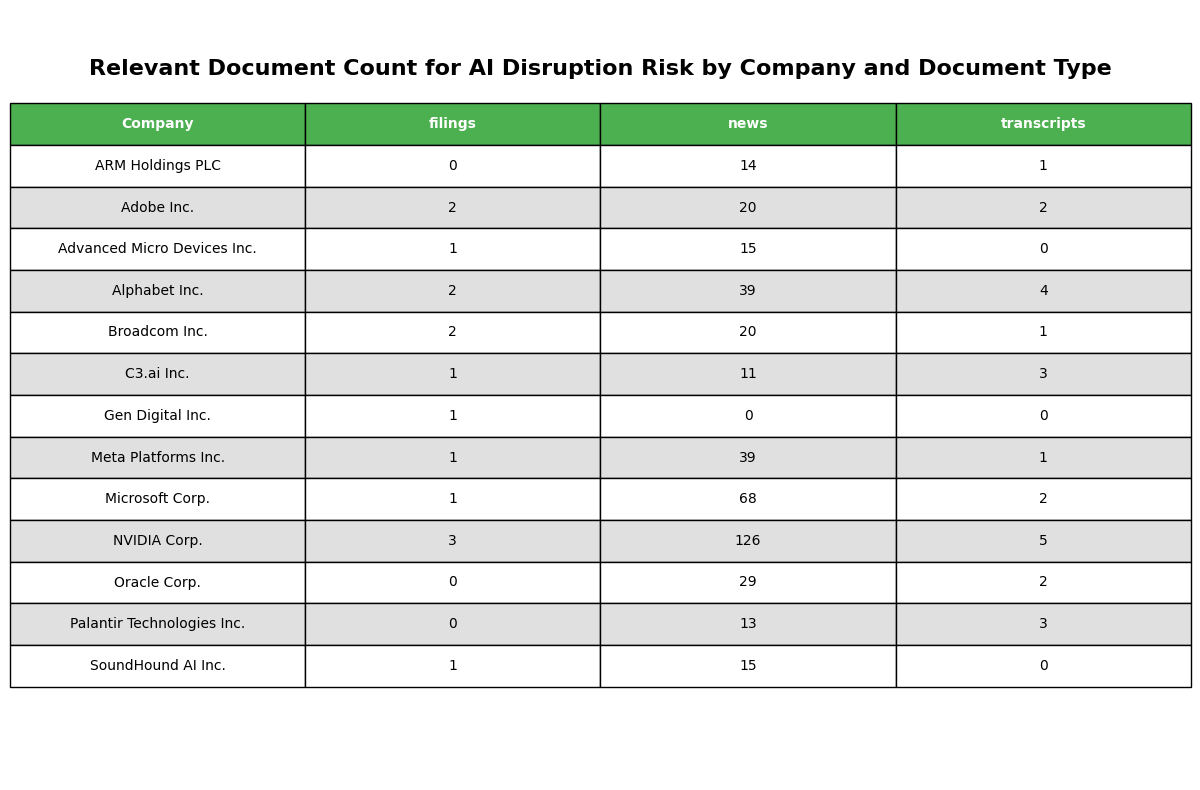
Summarizer
The following code is used to create a summary for each company using the information from the retrieved documents.Getting the Scores
Processing the datasets and computing the AI Disruption Risk Score and AI Proactivity Score.Final Dataset
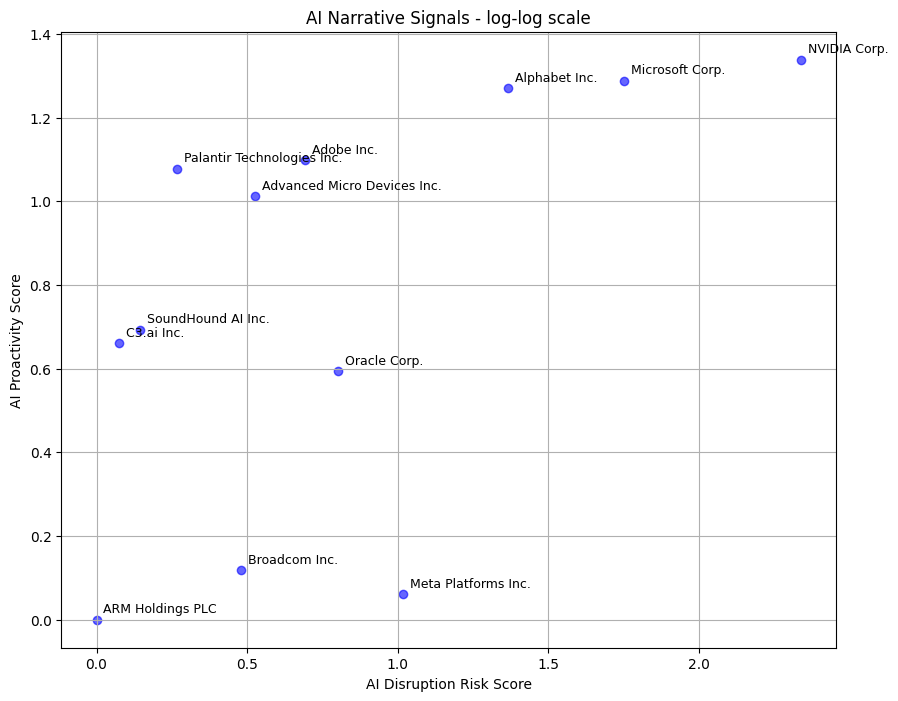
The final dataset for the report is generated by processing and merging the risk and proactivity datasets.Results Visualization
This is to visualize the values for each of the companies AI Disruption Risk Score vs AI Proactivity Score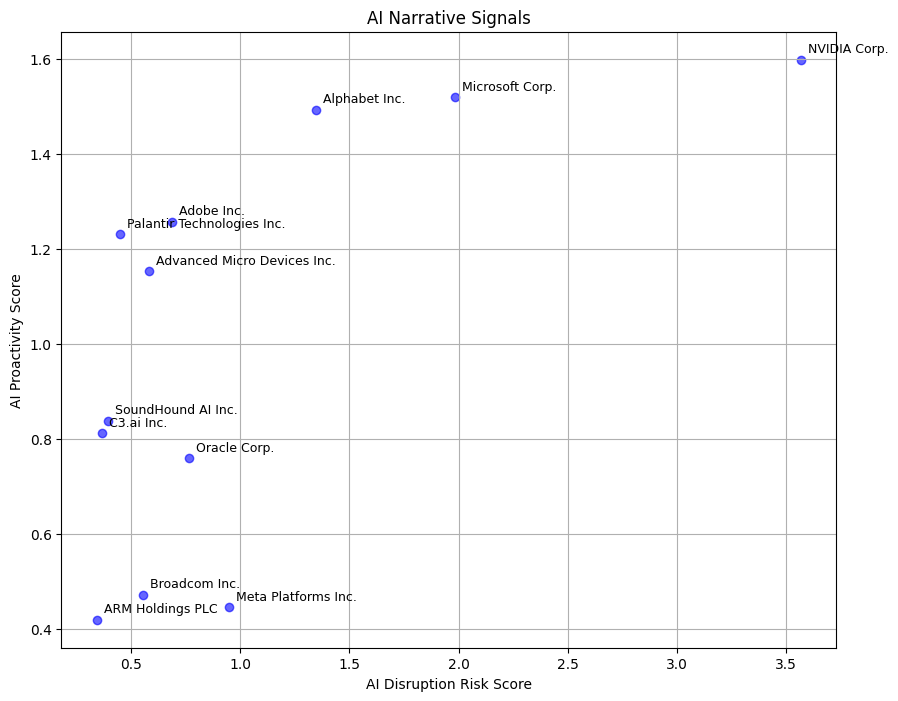
Generate Final Report
Using the results, an example of how a report could be formatted is provided in the cookbook.Score Definitions
AI Disruption Risk Score: The number of unique documents related to the risk of GenAI disruption, normalized by the average number of risk documents retrieved across the entire watchlist.AI Proactivity Score: The number of unique documents related to the proactive adoption of GenAI, normalized by the average number of proactivity documents retrieved across the entire watchlist.AI Proactivity Minus Disruption Risk Score: The difference between the AI Proactivity Score and the AI Disruption Risk Score. A higher score indicates a stronger company response relative to the identified risks.
1. Palantir Technologies Inc. 🥇
AI Proactivity Minus Disruption Risk Score: 0.72AI Disruption Risk Score: 0.48 / Nb Documents Risk: 18AI Proactivity Score: 1.19 / Nb Documents Proactivity: 45
AI Disruption Risk
Palantir Technologies Inc. faces significant risks related to AI disruption, particularly from emerging competitors like DeepSeek, which could undermine its market position and pricing model. The company’s reliance on government contracts exposes it to vulnerabilities from potential policy changes and defense spending cuts, which could impact its revenue stability. Additionally, the rapid commoditization of AI models and the increasing competition from larger tech firms threaten to erode Palantir’s competitive advantages, especially as AI infrastructure evolves. Investors are advised to remain cautious due to these competitive pressures and the high valuation of Palantir’s stock amidst these uncertainties.
AI Proactivity
Palantir Technologies Inc. has significantly advanced its integration of Generative AI (GenAI) through various strategic partnerships, including collaborations with EllisDon, SAUR, and TWG Global, aimed at enhancing operational efficiencies and transforming contract management processes. The company has also formed alliances with Databricks and Everfox to deliver secure AI solutions and improve military operations, respectively. Notably, Palantir’s AI services have driven substantial revenue growth, with a reported $1.8 billion in contracts and a 73% increase in its U.S. commercial customer base. These initiatives underscore Palantir’s commitment to leveraging AI across multiple sectors, including defense, healthcare, and financial services, positioning it as a leader in the AI landscape.
2. Advanced Micro Devices Inc. 🥈
AI Proactivity Minus Disruption Risk Score: 0.69AI Disruption Risk Score: 0.45 / Nb Documents Risk: 17AI Proactivity Score: 1.14 / Nb Documents Proactivity: 43
AI Disruption Risk
Advanced Micro Devices Inc. (AMD) faces significant risks related to AI disruption, including a decline in market share due to competition from Nvidia and emerging custom AI chip solutions from companies like Broadcom and Marvell. The company’s heavy investment in AI has not yielded expected returns, with recent reports indicating a 9.9% drop in shares following disappointing AI chip revenue and a forecasted 7% decrease in data center sales. Additionally, AMD is projected to incur an $800 million loss due to export restrictions on its AI chips, further complicating its financial outlook. Analysts have expressed concerns over AMD’s ability to sustain growth in the AI sector, leading to downgrades and reduced price targets amid a challenging market environment.
AI Proactivity
Advanced Micro Devices Inc. (AMD) has made significant strides in integrating Generative AI (GenAI) into its product offerings and forming strategic partnerships to enhance its AI capabilities. Notably, AMD’s collaboration with Absci, which includes a $20 million investment, aims to accelerate AI-driven drug discovery, leveraging AMD’s high-performance computing solutions. Additionally, AMD’s partnerships with companies like Dell and Ocient focus on enhancing AI capabilities in commercial devices and data analytics, respectively. Furthermore, AMD’s recent acquisition of ZT Systems is set to bolster its AI infrastructure, enabling faster deployment of AI solutions tailored for various customer needs.
3. Adobe Inc. 🥉
AI Proactivity Minus Disruption Risk Score: 0.61AI Disruption Risk Score: 0.66 / Nb Documents Risk: 25AI Proactivity Score: 1.27 / Nb Documents Proactivity: 48
AI Disruption Risk
Adobe Inc. faces significant risks related to AI disruption, particularly in monetizing its AI innovations like Firefly, which has shown user engagement but lacks clear revenue growth strategies. The company is under pressure from established competitors like Microsoft and Salesforce, which have stronger pricing power and bundled offerings, potentially limiting Adobe’s market share. Additionally, regulatory challenges and compliance costs associated with AI could hinder Adobe’s ability to adapt and innovate effectively, impacting its financial performance. Concerns about the rapid evolution of AI technologies and the competitive landscape further exacerbate the uncertainty surrounding Adobe’s future in the market.
AI Proactivity
Adobe Inc. is significantly enhancing its product offerings through the integration of generative AI (GenAI) technologies, particularly with its Firefly suite, which has been embedded across Creative, Document, and Experience Clouds to improve user productivity and streamline workflows. Partnerships with companies like IBM and Publicis Groupe are expanding Adobe’s capabilities in digital marketing and content creation, leveraging Firefly for personalized customer experiences and efficient content production. The launch of new AI-driven features, such as the Firefly Video Model and Acrobat AI Assistant, is expected to drive revenue growth and user engagement, with Adobe’s AI innovations already contributing to a substantial increase in annual recurring revenue. As of early 2025, Adobe’s strategic focus on GenAI is positioned to attract new users and enhance retention, further solidifying its market leadership in creative and marketing solutions.
Export the Results
Export the data as Excel files for further analysis or to share with the team.Conclusion
The Report Generator provides a comprehensive automated framework for analyzing AI threats and opportunities across your investment universe. By systematically combining advanced information retrieval with LLM-powered analysis, this workflow transforms unstructured data from news, filings, and transcripts into actionable intelligence for strategic decision-making. Through the automated analysis of AI disruption risks and proactive responses, you can:- Identify AI-resilient leaders - Discover companies that are not only aware of AI disruption risks but are actively positioning themselves to capitalize on these changes through strategic partnerships and product integration
- Assess competitive positioning - Compare how companies within your watchlist are responding to AI transformation relative to their peers, highlighting potential winners and laggards
- Quantify risk-response balance - The AI Proactivity Minus Disruption Risk Score provides a clear metric to identify companies that demonstrate strong strategic responses relative to their exposure to AI-driven market disruption
- Monitor strategic evolution - Track how companies’ AI strategies and risk profiles evolve over time, enabling dynamic watchlist adjustments based on changing competitive landscapes
- Generate watchlist insights - Create comprehensive reports that can inform investment committees, risk management decisions, and thematic investment strategies